THE MAGINITUDE OF THE
UNIVERSAL SERVICE
FUNDING REQUIREMENT
8.1 Aggregate effect of correcting the BCM
We analyzed the implications of correcting several inputs in the BCM by rerunning the model with some of the revisions discussed in detail in Chapter 5 and Chapter 6. These revisions partially correct the model in order to better simulate a proxy network that provides a single line to each household.[1] The analysis that follows (displayed in the accompanying tables) summarizes, in two scenarios, the output data that result from the combined recommendations contained in the previous chapters. The two scenarios show results with and without an adjustment for the subscribership rate. These two scenarios -- which we ran for the State of Washington -- use the following ETI partially corrected data and assumptions:[2]
Without adjustment for subscribership:
* A cost factor of 22.97%, i.e., "Cost Factor 2" which, as a forward-looking cost factor, is more appropriate for the cost proxy model than the historical "Cost Factor 1."
* Effective per-line switch costs of $167 to correct the BCM's implausibly high switch cost;[3]
* Objective distribution fill factors of 95% for all density zones;
* Objective feeder fill factors of 95% for all density zones;
* An adjustment to the structure multiplier in rural areas; and
* Objective SLC and AFC fill factors of 95%.
With adjustment for subscribership:
* All of the previous corrections; and
* We divided the average cost per line by 0.960 (the subscribership rate in Washington) to reflect the fact that universal service objectives require the accessibility by all households of affordable basic local exchange service, but not all households subscribe.[4]
The results of our corrections yield cost data that are upper bounds to the cost that would result if it were feasible to implement all ETI corrections. The partially corrected average cost of $12.58 per month[5] for the State of Washington should be reduced further for the following reasons:[6]
* The BCM does not make the copper/fiber crossover decision in an economic manner.
* The assumption of uniform density within a CBG is incorrect and results in an overstatement of the cost of serving the average customer within each CBG.
* We made no correction for the inflated SLC and AFC costs nor the correspondingly low SLC and AFC discounts.
Moreover, the amount of universal service requirement is overstated for the following reasons:
* The aggregate requirements are based upon average costs in each CBG that, despite the ETI partial corrections, are still too high.
* After the BCM completes its computation of CBG costs, it should then aggregate these results to the wire center level before the need for universal service support is evaluated. Because the method in the BCM is to assess universal service requirements at the CBG level, the final results of the BCM are overstated.
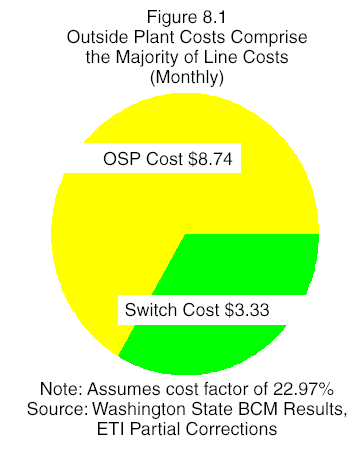
Similar to Figure 5.1 in Chapter 5, the ETI partial corrections still show that, not surprisingly, the outside plant comprises the majority of the overall line cost. The ETI partial corrections show that 72% of the overall line cost is attributed to outside plant, while the switch cost accounts for 28% of the overall cost.[7] In comparison, the BCM results for Washington State produce an overall average cost of $16.94 which consists of $11.31 outside plant cost (67%), and a $5.63 switch component (33%).
As Table 8.3 shows, based upon ETI corrections that were feasibly incorporated into the BCM, the corrected BCM yielded annual universal service support requirements for the State of Washington that range between approximately $11-million and $29-million, depending upon the price threshold. These results were less than half of the levels computed by the uncorrected BCM.
Table 8.1  The BCM
Overstates the USF
Requirement Data
for Washington
State without
Adjustment for
Subscribership
                            BCM            ETI Partially     Percent Difference
                                           Corrected BCM
Average Monthly            $16.94              $12.08              (29%)
Cost
Total USF               $50,692,630         $15,768,466            (69%)
Requirement
(Annual)
Notes:  USF
requirement
figures reflect a
price threshold of
$30 per month and
a cost factor of
22.97%.  See
Appendix 8B.
In Table 8.1, we see that the USF requirement is reduced dramatically by the ETI partial corrections. Clearly the "need" calculated by the BCM is overstated. Moreover, we observe that the effect of the ETI partial corrections has a greater effect on the total USF requirement (69% reduction) than on the average monthly cost (29% reduction). From this finding, we can infer that the inadequacies of the BCM are predominantly related to the pricing of high-cost areas.
Table 8.2  The BCM
Overstates the USF
Requirement Data
for Washington
State Including
Adjustment for
Subscribership
                            BCM            ETI Partially     Percent Difference
                                           Corrected BCM
Average Monthly            $16.94              $12.58              (26%)
Cost
Total USF               $50,692,630         $17,429,545            (66%)
Requirement
(Annual)
Notes:  USF
Requirement
figures reflect a
price threshold of
$30 per month and
a cost factor of
22.97%.  The BCM
does not include
an adjustment for
subscribership
rate.  See
Appendix 8B.
Similar to Table 8.1, Table 8.2 displays ETI's partial corrections, but in addition, incorporates an adjustment for the penetration rates: Those who are not being provisioned phone service are not contributing to the overall costs. Thus, the costs cannot be spread over the entire population, but merely those who subscribe, which in Washington State, is 96.0% of the households. The BCM does not account for this adjustment. However, to allow us to develop a factor by which we can extrapolate from the Washington State data to the national level, Table 8.3 only reflects a penetration adjustment for the ETI corrections. As an illustration, BCM costs that include a correction for penetration rate would yield a state average cost of $17.65 a month ($16.94/0.96) and a total USF requirement of $53,086,072 ($50,692,630/0.96). Even correcting for the penetration rate, a correction which presumably adds costs to those who do subscribe, our analysis still shows a difference of more than 60% between the USF support calculated by the BCM and ETI's partial corrections.
 Table 8.3  Comparative
 Summary Results of the
     BCM and the ETI
 Partially Corrected BCM
    Washington State
                                 BCM         ETI Partial       Percent
                                             Corrections      Difference
  Annual Benchmark Cost     $380,427,268     $282,552,902        26%
     Support at $20          $77,846,835     $29,230,056         62%
     Support at $30          $50,692,630     $17,429,545         66%
     Support at $40          $37,662,589     $11,430,572         70%
  Average Monthly Cost         $16.94           $12.58             26%
Notes:  ETI partial
corrections include
adjustment for
penetration rate. See
Appendix 8B.
Table 8.3 displays the effect of ETI's partial corrections for the three universal service support levels and for cost data. Most notably, ETI's corrections show a requirement for universal service support of 62% to 70% less than that computed by the uncorrected BCM depending upon the support threshold level. Consistent with our previous analysis, the effects of ETI's calculations show greater reductions for USF support than for the annual benchmark cost and average monthly cost. This again supports the conclusion that ETI's corrections disproportionately remedy inadequacies in how the BCM calculates support for rural areas which tend to be the most important in determining high cost support.
  Table 8.4  Comparative
Summary Results of the BCM
   and the ETI Partially
  Corrected BCM National
 Total (excluding Alaska)
                                        BCM               ETI Partial Corrections
   Annual Benchmark Cost          $18,402,608,162              $4,784,678,122
      Support at $20               $3,977,572,193              $1,511,477,433
      Support at $30               $2,203,441,910               $749,170,249
      Support at $40               $1,372,205,121               $411,661,536
   Average Monthly Cost                $16.71                      $12.37
 Note: Adjustment factors
based upon a comparison of
  BCM and ETI results for
  Washington are used to
    create national ETI
         results.
Due to the time constraints associated with running the BCM for the entire country, we examined the ratios of the ETI results to the BCM results for Washington State in order to develop very approximate "national adjustment factors." The purpose of developing these national adjustment factors is to yield approximations of the national results, assuming that ETI's corrections were implemented by the Commission. The results of applying these adjustment factors to the BCM yields national numbers which are shown in Table 8.4. We recommend, however, that the entire country be run with the ETI corrections on a state-by-state basis.
[2]See Appendix 8B for the BCM's print-out of the results pages of the partially corrected BCM.
[3]This means that ETI eliminated the $647,526 common processor cost, and that, therefore, the following factors became irrelevant in the BCM: the 79% allocation and the 1.75 business gross up factor.
[4]Those that do not subscribe to service necessarily are not making any payment for telephone service, yet the network is configured to be ready to serve them. We did not make this correction in isolation but rather incorporated it into the final "partially corrected" run of the BCM. (Our analysis made this adjustment by taking the column of final BCM-computed cost results and dividing it by 0.960 before determining universal service requirements.)
[5]See Appendix 8B.
[6]The BCM does not yet include the SAI (which likely would lead to an increase of less than a half-dollar).
[7]For this analysis we used ETI partial corrections without the correction for penetration rate.